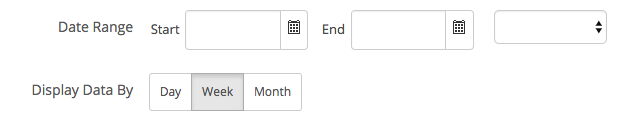
Field Squared has a set of built in reports to quickly get an at-a-glance accounting of work being performed within your company. To see different data sets, a user selects a date range, and how they would like the data grouped, meaning totals will be calculated by days, or by adding the daily totals into weeks or months.
All standard reports provide the data in a new window, combining both the data and the associated charts. Be sure pop-ups are enabled to ensure visibility of results. Some reports allow for the formatting option of a HTML or Grid.
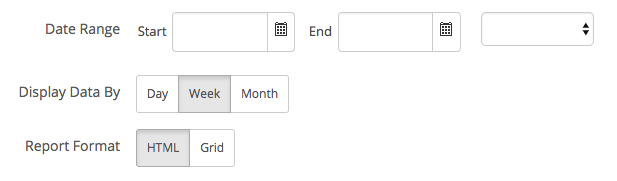
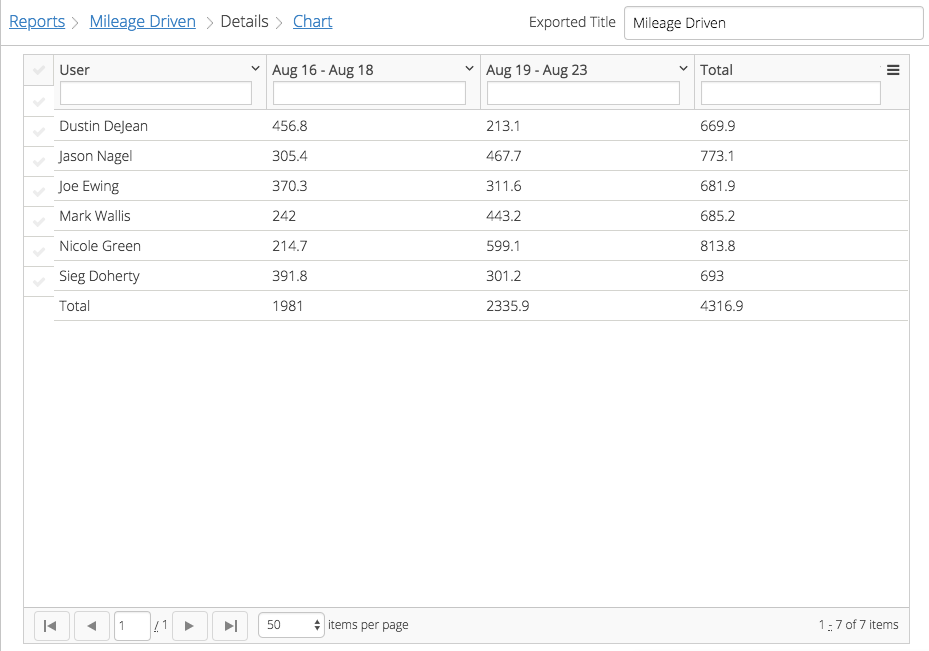
HTML formatting provides the data in a new window, whereas the Grid format puts the data into the grids seen across the Field Squared platform. This will be shown right in the same window. This grid can be sorted, filtered, resized, and exported as a PDF or CSV file. The associated charts will also be available.
Standard Report Types and Features
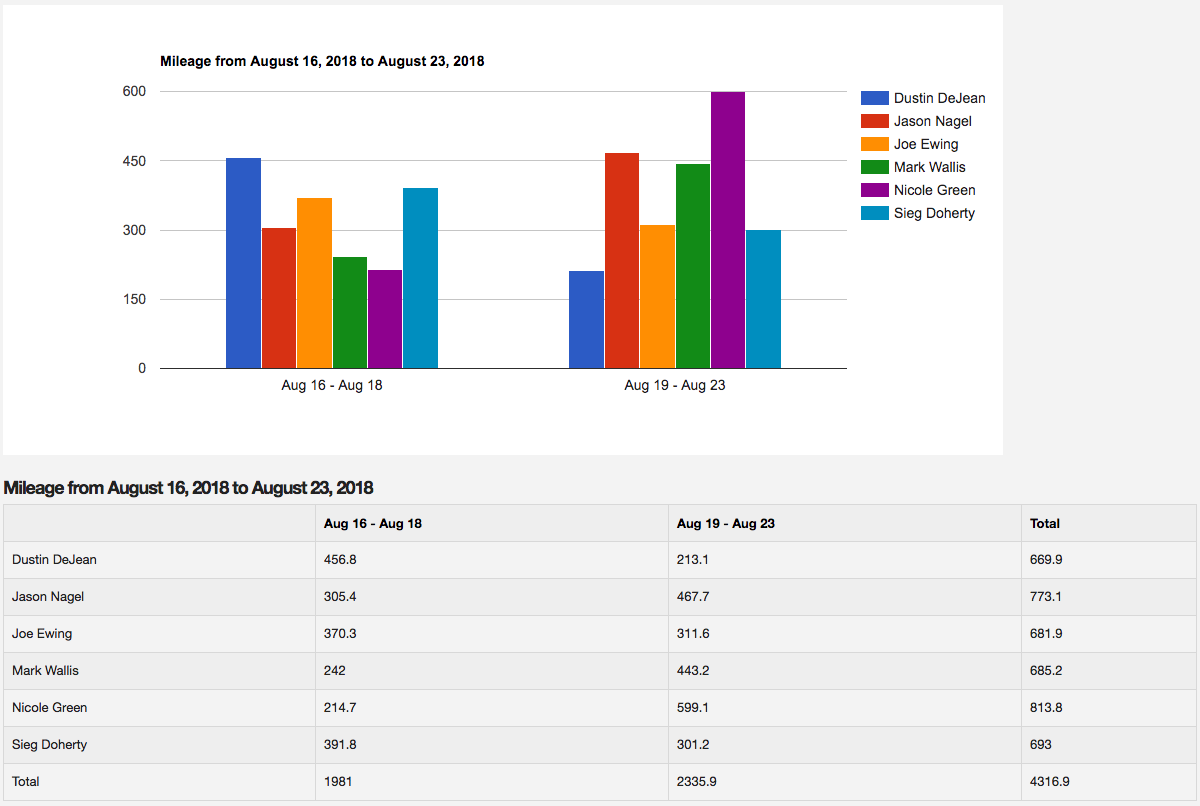
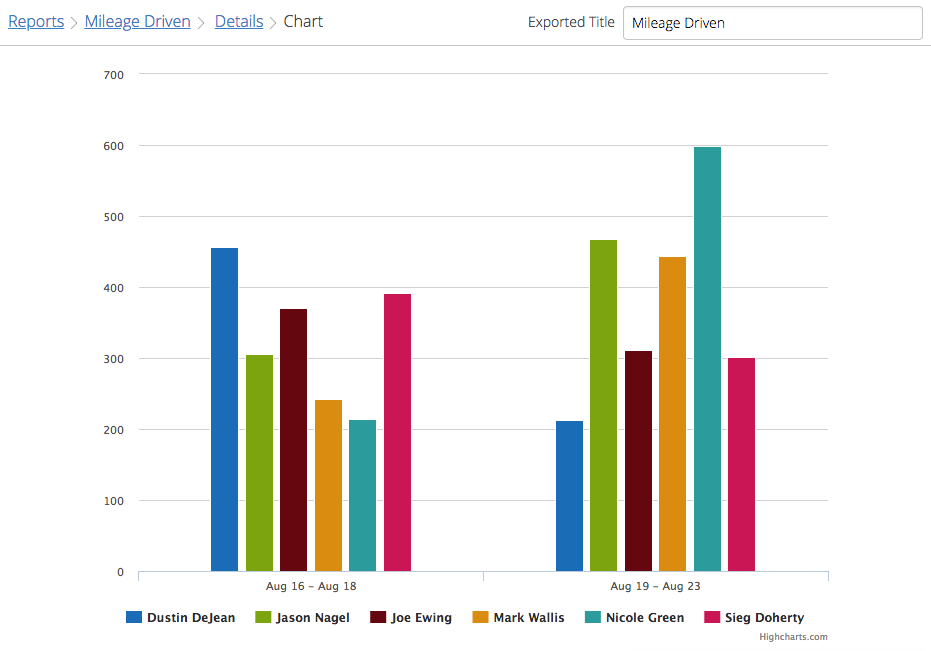
Mileage Driven
- Organized by user
- Gives the total travel distance of each user in miles
- Include proposed mileage – adds a new row that shows the total mileage that was planned as well as the actual mileage driven
- Includes a bar graph of each user's mileage
- Includes grid formatting option
Windshield Time
- Organized by user
- Gives the total travel time of each user in hours
- Includes a bar graph of each user's drive time
- Includes grid formatting option
App Usage
- Organized by user
- Shows the total time logged into app of each user in hours
- Includes a bar graph of each user's user time
- Includes grid formatting option
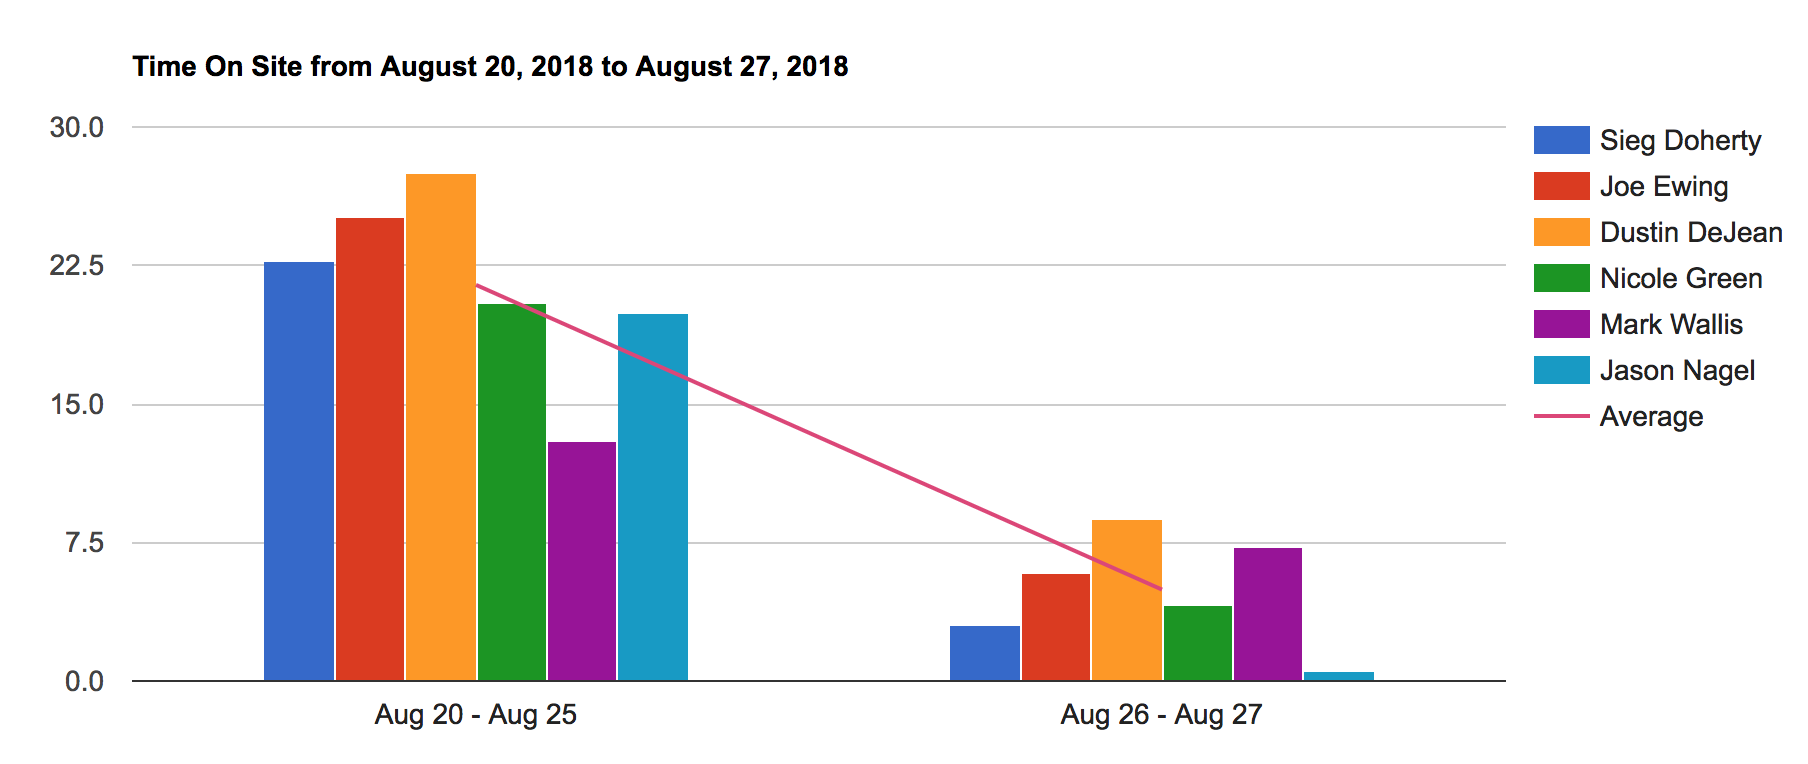
Time on Site
- Organized by task
- GPS scheduled time on site Gives a summary of each job scheduled that week
- Display data in day, week, month (Gives total)
- Includes a bar graph of each user's time on site
- Opens in a new window
Time By Task/User/Status
- Organized by task
- shows how long it stays at a status until that same user changes the status
- Include proposed mileage
- Opens in a new window
On Site Time By Task Type
- Organized by task type
- Total time logged into app
- Display data in day, week, month (Gives total)
- Includes a pie chart of percentage by task type
- Includes grid formatting option
Time Breakdown
- Organized by time and user
- Shows where the user was during the hours of the day
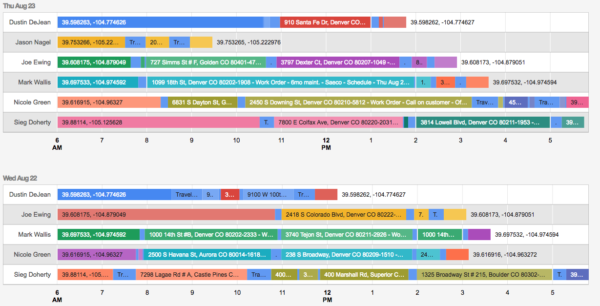
- Includes the above visual of time breakdown by task
- Opens in a new window
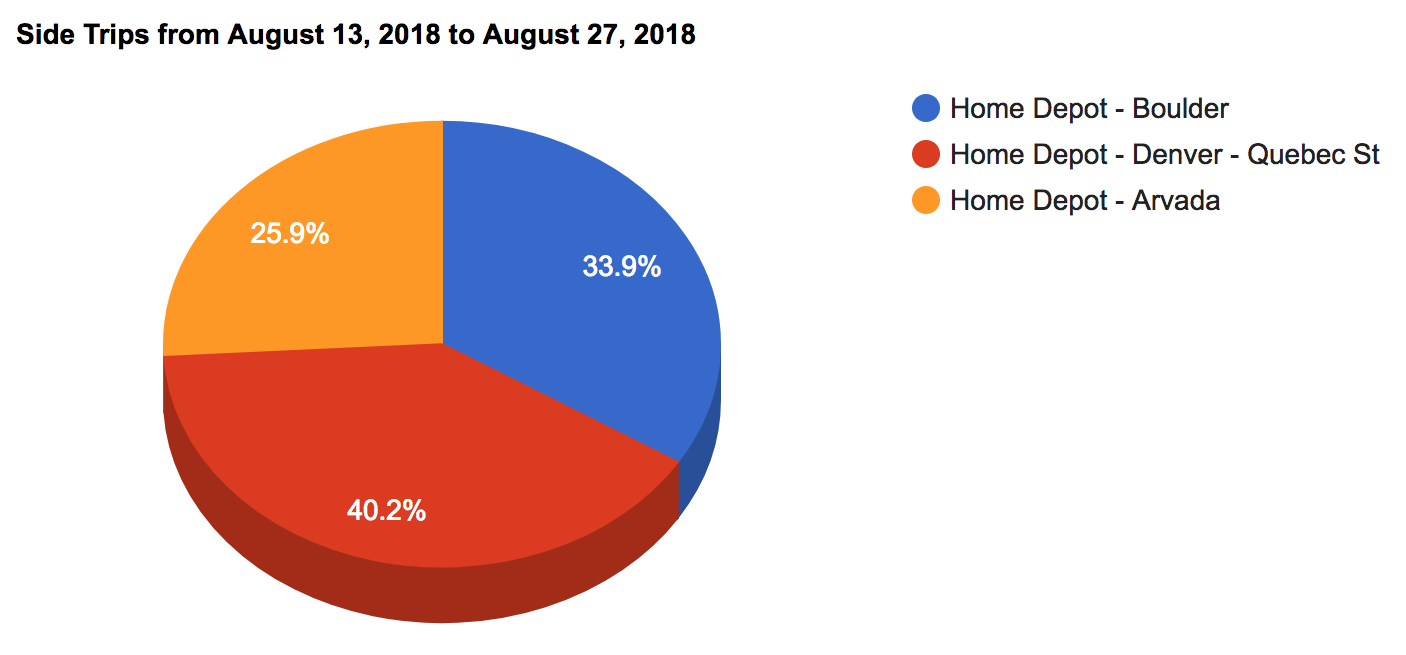
Side Trips from Tasks
- Organized by task schedule
- Shows scheduled times and actual times
- Shows travel pattern – stops and starts
- Shows trips taken away from task
- If a contact is marked as a supplier, those trips are listed at the top of the report
- Includes pie chart of percentage of time at each supplier
- Includes grid formatting option
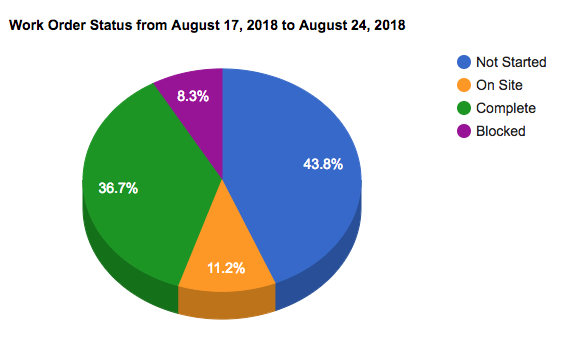
Task Status
- Organized by schedule and task
- Displays a summary of each task scheduled during the selected time
- Includes pie chart of percentage of tasks at each status
- Opens in a new window
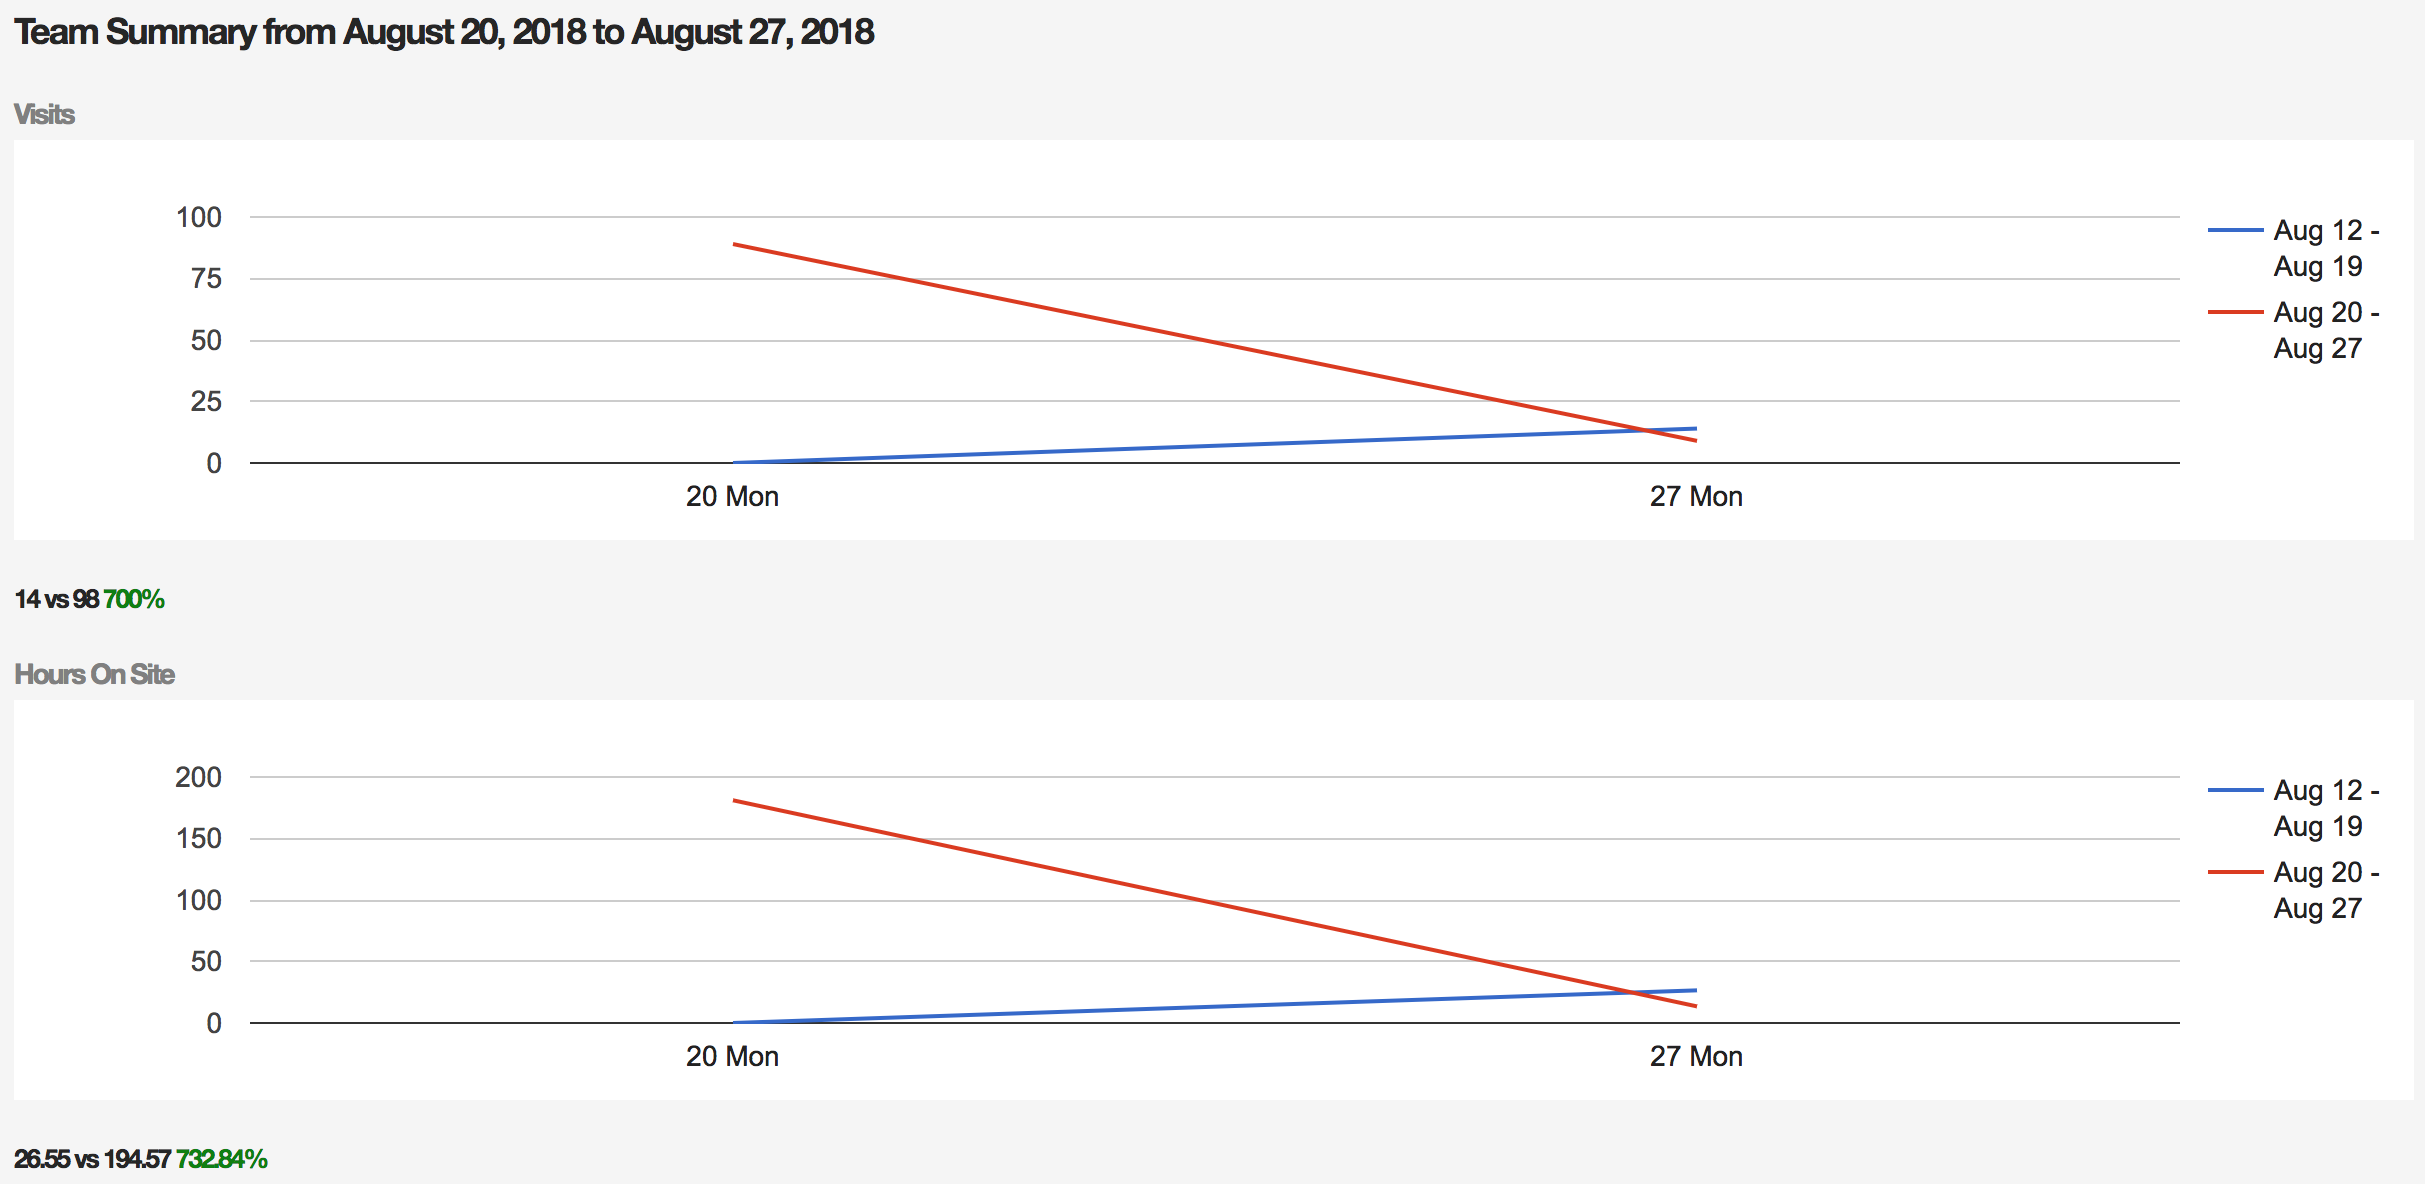
Team Summary
- Organized by task type
- Shows total time spent on each task type
- Includes line graphs of each task type
- Includes grid formatting option