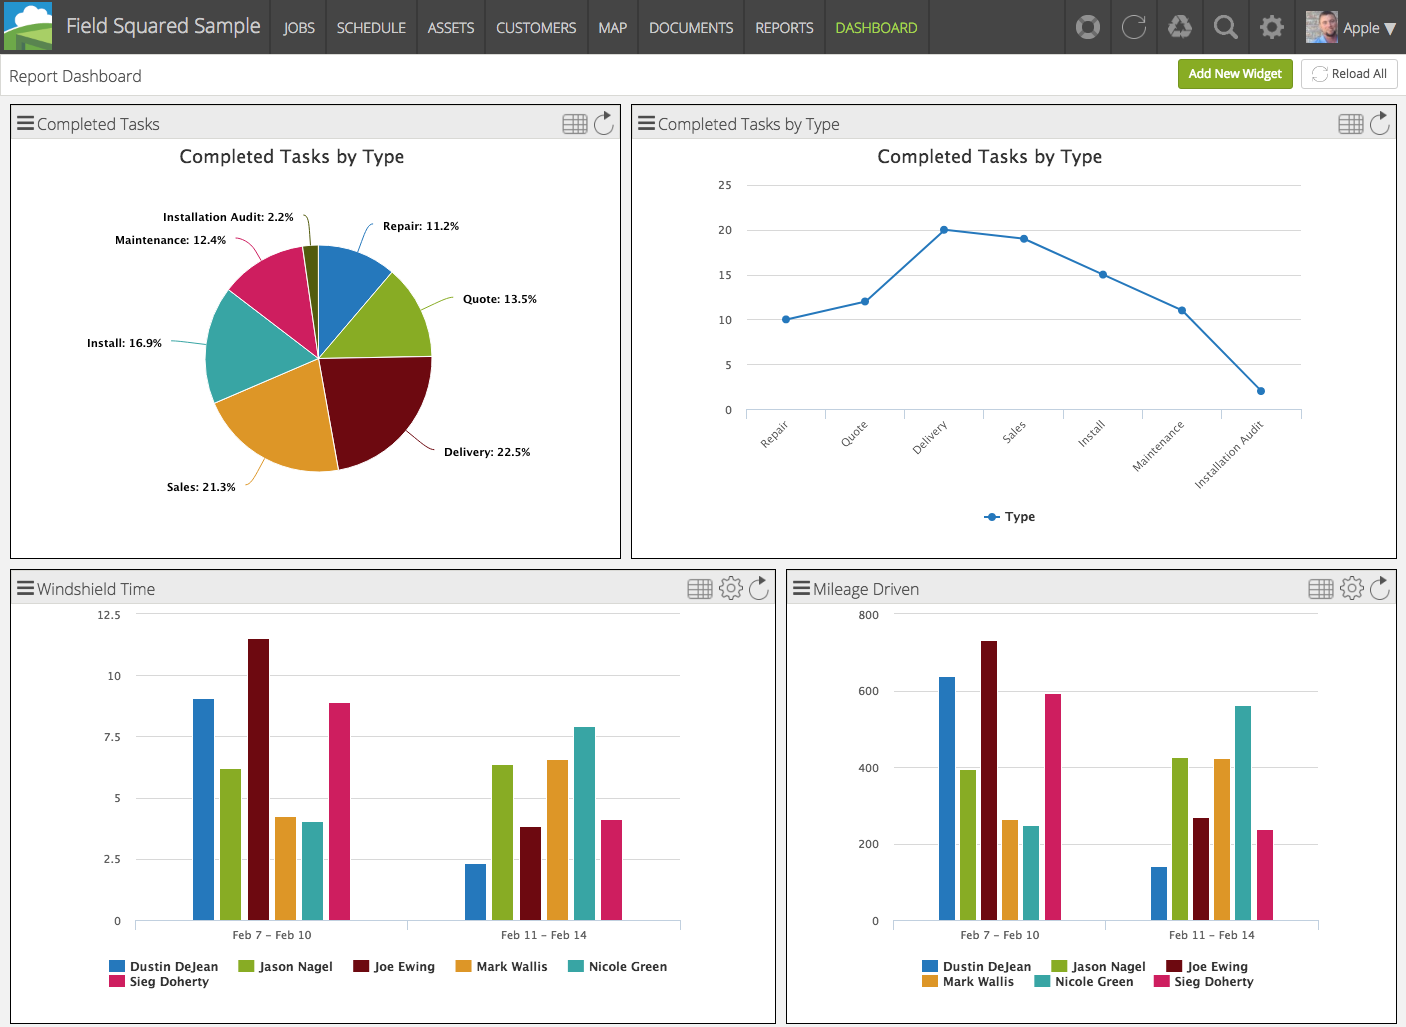
The Dashboard provides an at-a-glance view of charted reports within the workspace in the form of widgets. Each user can customize their own dashboard to see the data that is the most beneficial to them. Once configured, a dashboard is saved, making the most important data available in just one click.
Widgets
Widgets have the following abilities and features:
-
- Select a report- a widget can also be deleted from this menu.
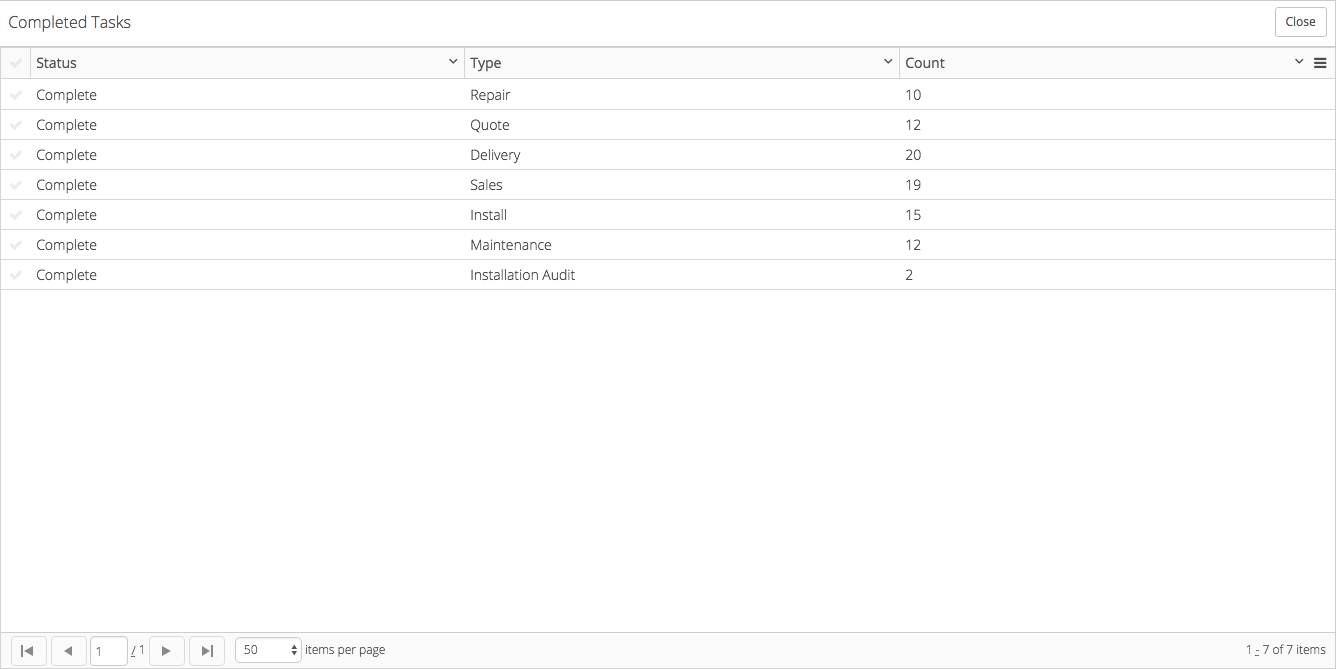
- Open Report Grid – Upon clicking this, a popup will appear with the report data in a sortable grid.
- Refresh report – Gets the most recent data and re-draws the chart
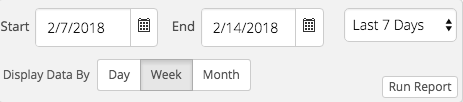
- Settings – Report inputs are available by clicking the gear icon. Input values will be saved between sessions.
- Resizing – The corners of each widget are responsive and can be resized to your liking.
- Drag and drop positioning – Each widget can be dragged and dropped around throughout the dashboard to allow strategic and priority positioning
Setting up a Widget
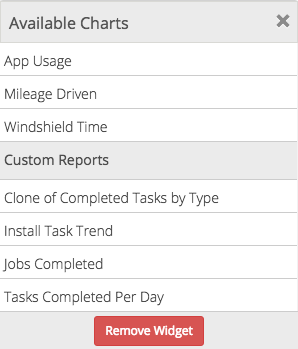
- The first step is to add a blank widget. This can be done from the Add New Widget button in the top right.
- Next, select which report the widget is about.
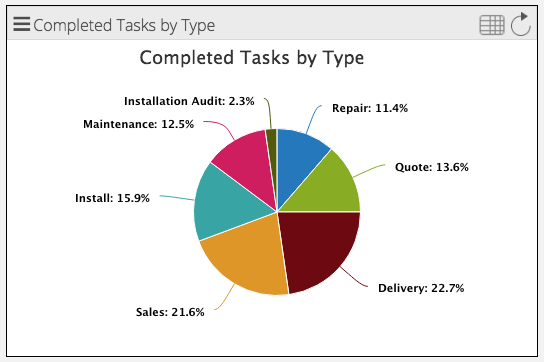
- By clicking the icon in the top left corner, a menu opens where you can choose from chartable standard reports, as well as any workspace reports that have configured charts.
-
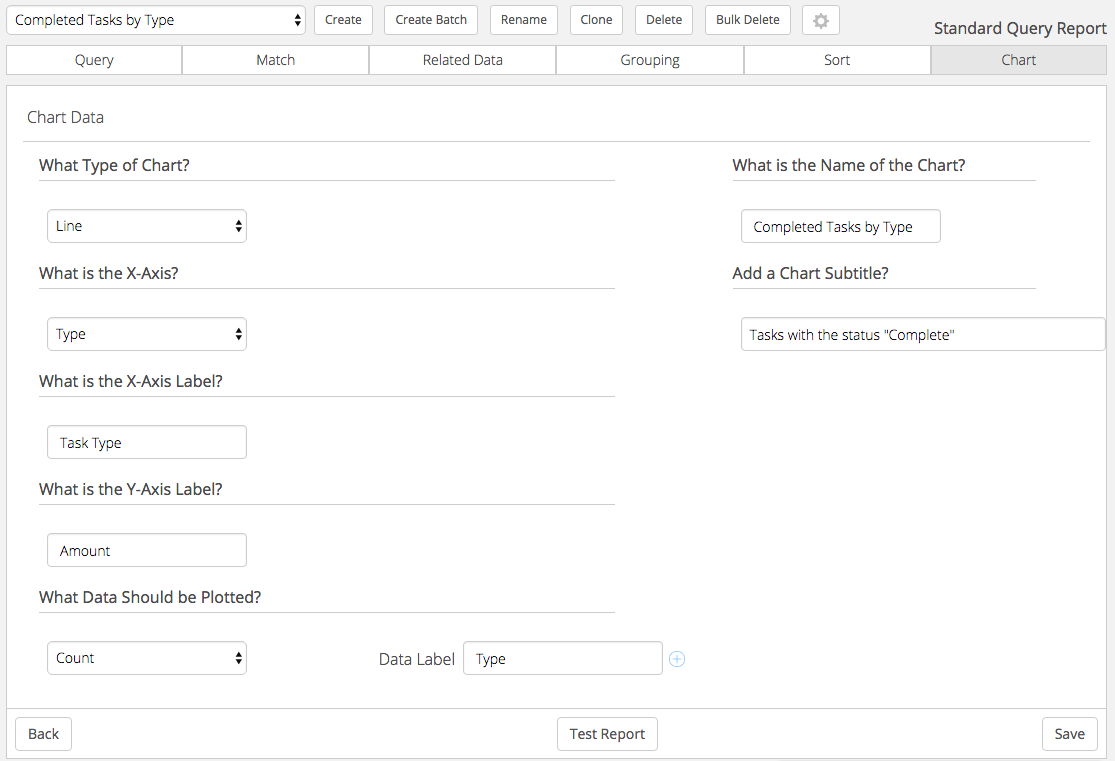
- Available custom reports are any reports created in Report Builder that have completed the Charts tab. This could be a bar, column, line, pie, or 3d pie chart.
- If the widget has inputs or filters, fill out those fields from the menu that appears upon clicking the gear icon.
- Each widget can be resized to dragging the corners or sides. You can also rearrange the order of widgets. This configuration will be saved between settings.
- Report data is available in a popup by clicking the grid icon. The data can be sorted, filtered, and even exported to a PDF or CSV here.
- Refreshing – You can either refresh each widget individually by clicking the refresh icon, or refresh all the widgets by clicking the Reload All button in the top right corner.
