Using a document grid, there are two different ways to create a coordinating chart: the document grid itself or via a chart custom field.
Choosing which data to plot
- Both methods of charting require configuration from Document Grid Properties popup
- Select the data to be plotted by selecting the box under the chart icon.
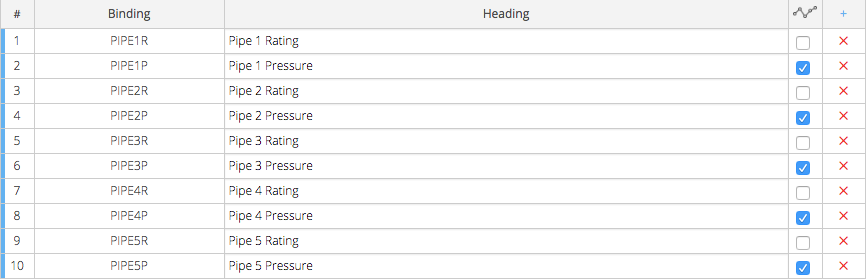
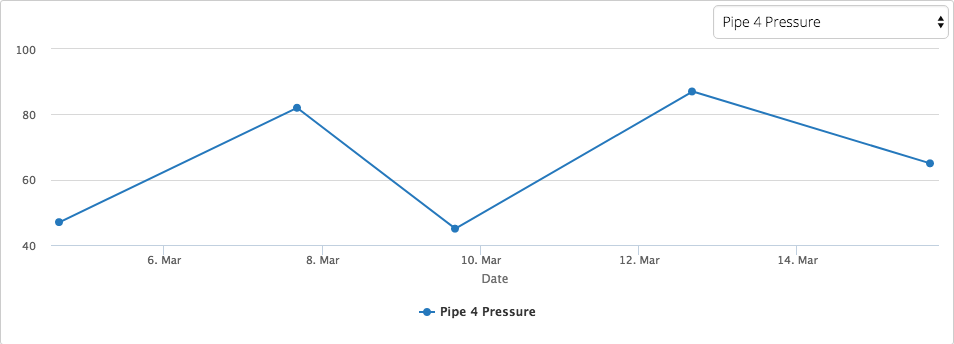
Chart Custom Field
- Link to Grid: The document grids on that same object will be listed. If there's no configured document grids on that object, you cannot use a chart custom field. There will be no data for it to pull from.
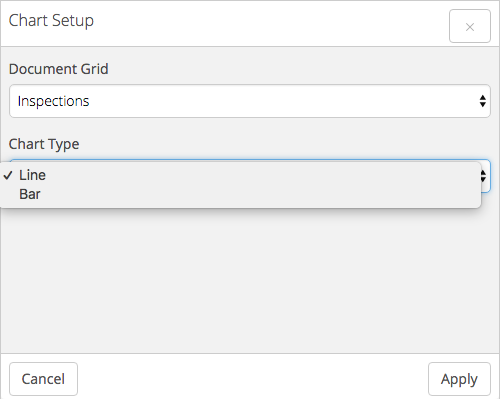
- Chart Type: Choose between Line and Bar charts
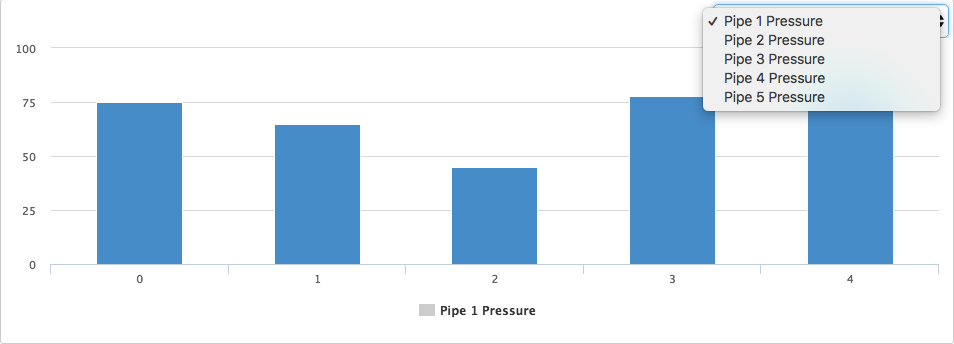
- Data Display: In the upper left of the chart, a dropdown will list the available data fields configured in the document grid. The chart will display one columns worth of data at a time.
Document Grid Chart
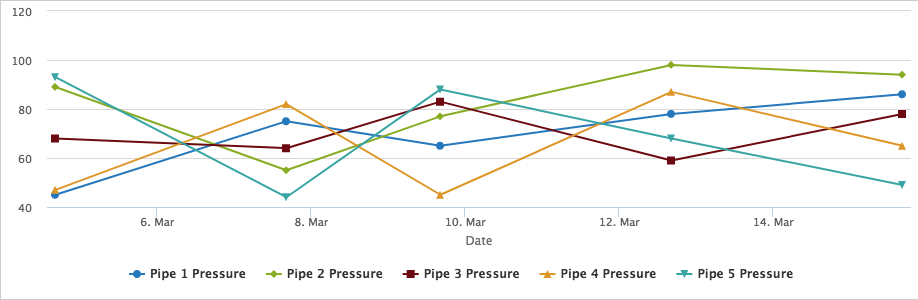
- Show Chart: If you select a type of graph, you will see a chart directly under your document grid.
- Chart Type: Choose between bar, line, bubble, or pie.
- Data Display: The chart will display all configured columns worth of data at once.
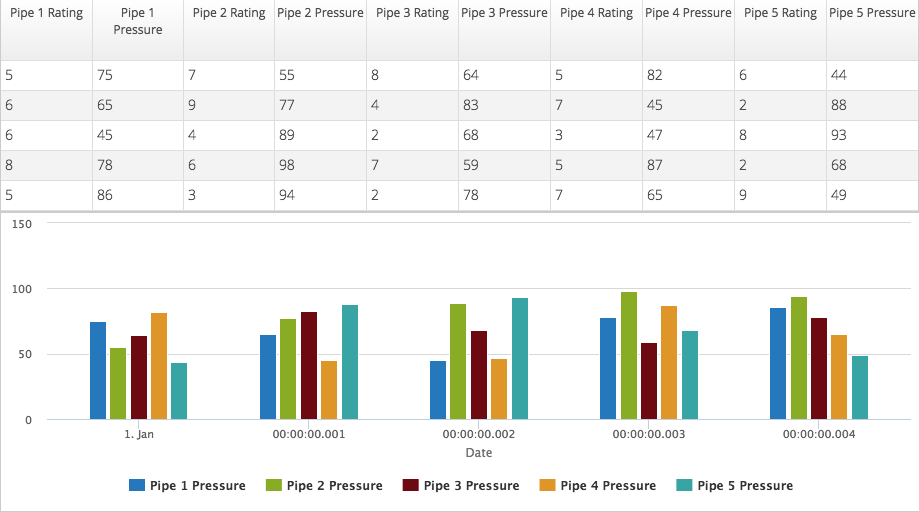
- Hide Grid: If a chart is configured, the document grid can be hidden, so just the chart is displayed.