Graphs
Part of document controls, graphs let you create simple line charts that display progress over time or over various input points.
Note: Graphs can only track and display number values. They are best used when gathering data from a Details Table which can use whatever data you assign to it via sub-forms.
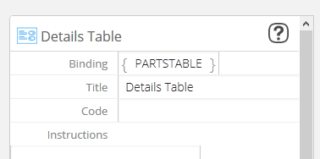
Details Table
The first step is to create the sub-form that is going to be assigned to the Details Table and add it to your document.
For a detailed guide on how to create Details Tables, see this article. Now that you have your table, let's move on to the next step. Getting graphs to display data.
Graph – How To
The graph control is simple enough to add to any document. Just drag and drop the control onto the document where you want it placed.
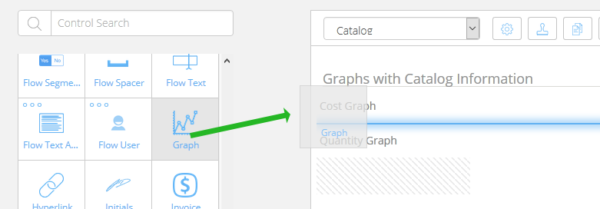
After you have done this, click the control. You'll see it's settings on the right side of the screen. Here you'll be able to change any setting and configure the graph to display the exact data you want graphed.
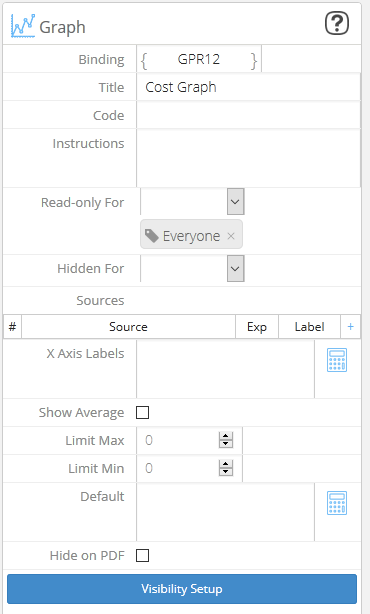
Source and Labels
In the image above you'll notice a section labeled Sources which defines what we will be graphing. In this section you'll see an area labeled Source. On the right you can see a "+" symbol. Click this to create a new line and add information.
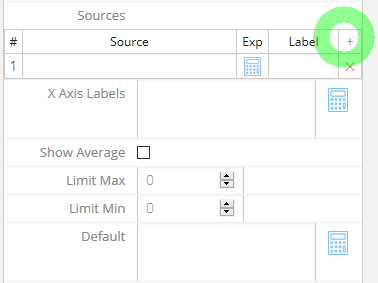
The line below labeled with a "1" is where we are going to add our expression that will retrieve data from the sub-document assigned to the Details Table.
{document.PARTSTABLE.select('COST')}
This is the range expression we are going to be using. The structure for this code is in the format:
object.BINDING.select('SUB-BINDING')
This expression means:
- document is the object we want to pull data from, which is the current document
- PARTSTABLE is the binding of the details table we are referencing.
- select() is a function that can select a range of data from a details table.
- COST is the BINDING for the document control in the sub-form we want to pull data from.
You can also read the expression from right to left. We want to select and display the COST for each item in the PARTSTABLE which is located in the current document.
X-Axis labels
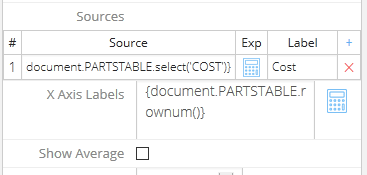
Next, the X Axis Labels. Here we are going to add another complex expression. Although it's not as defined as the complex source expression above, the expression in this section is only used to display the label.
{document.PARTSTABLE.rownum()}
The structure for this code is as follows:
object.BINDING.function()
This expression means:
- In the current document, document is the object we want data from.
- PARTSTABLE is the binding we are referencing. In this example it's the binding for the details table.
- rownum() is a function which calculates the row number or index for each item in a details table. The rownum() function doesn't include anything inside the brackets
We want to display the label data in the a row for each COST item in the PARTSTABLE which is located in the current document.
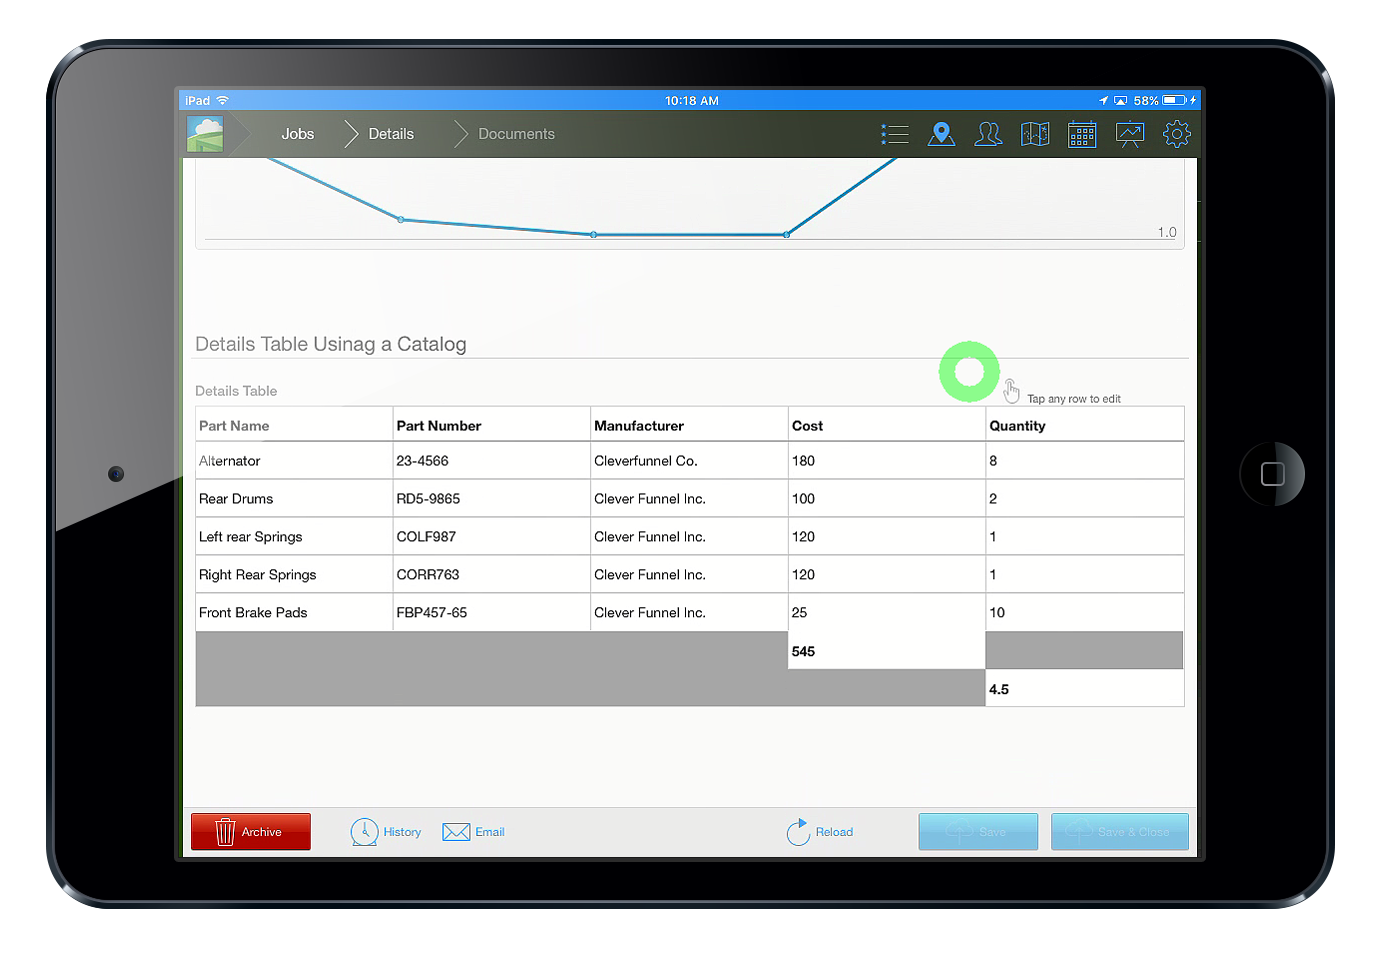
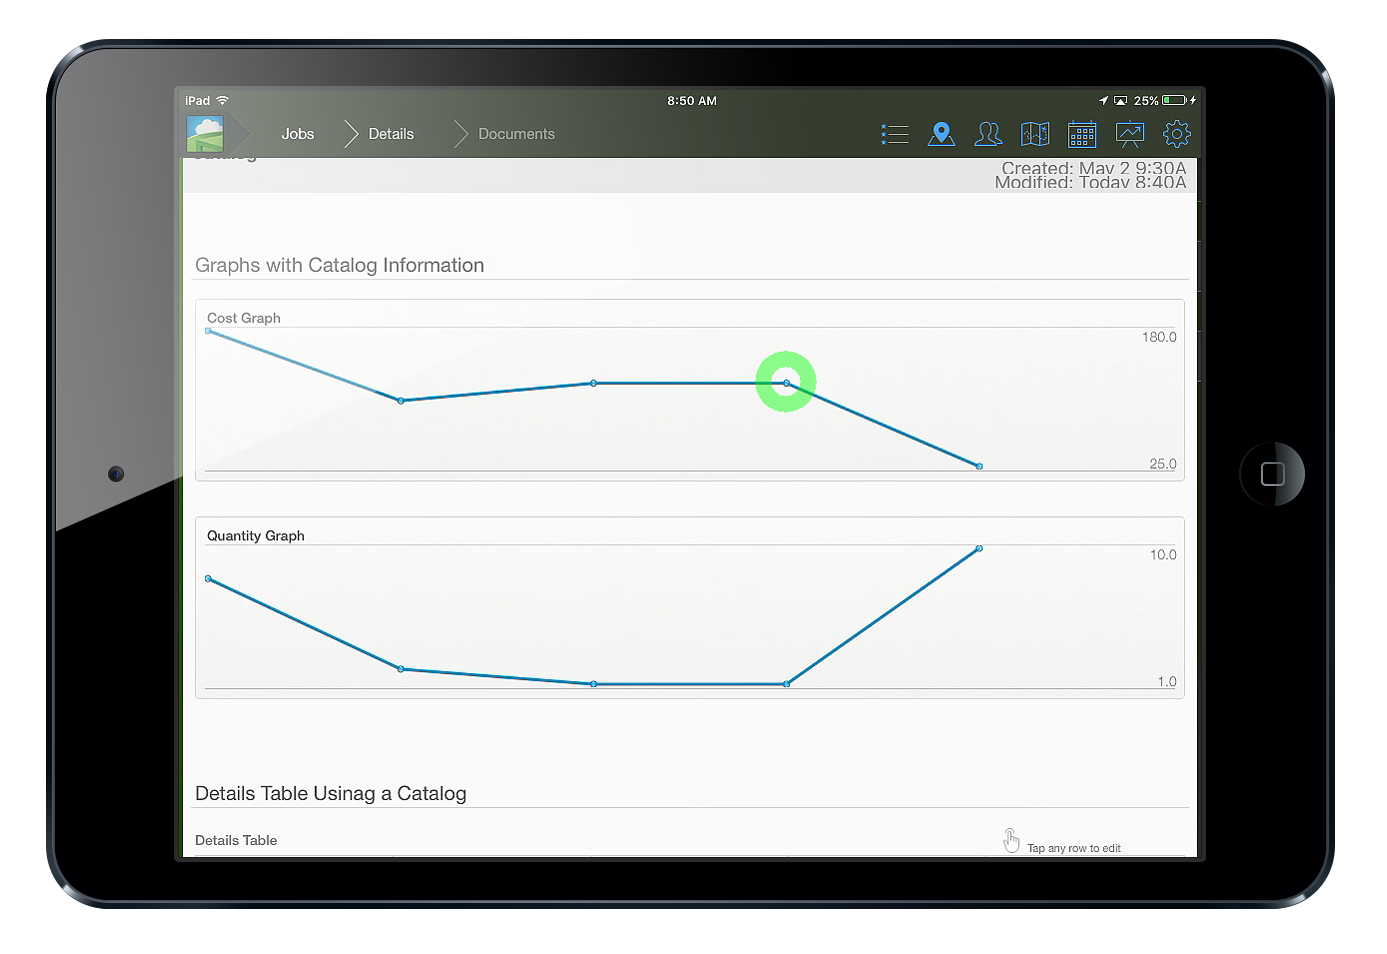
Results
After all of our work we now have a working line graph comprised of data pulled from a Details Table with a sub-form assigned to it.
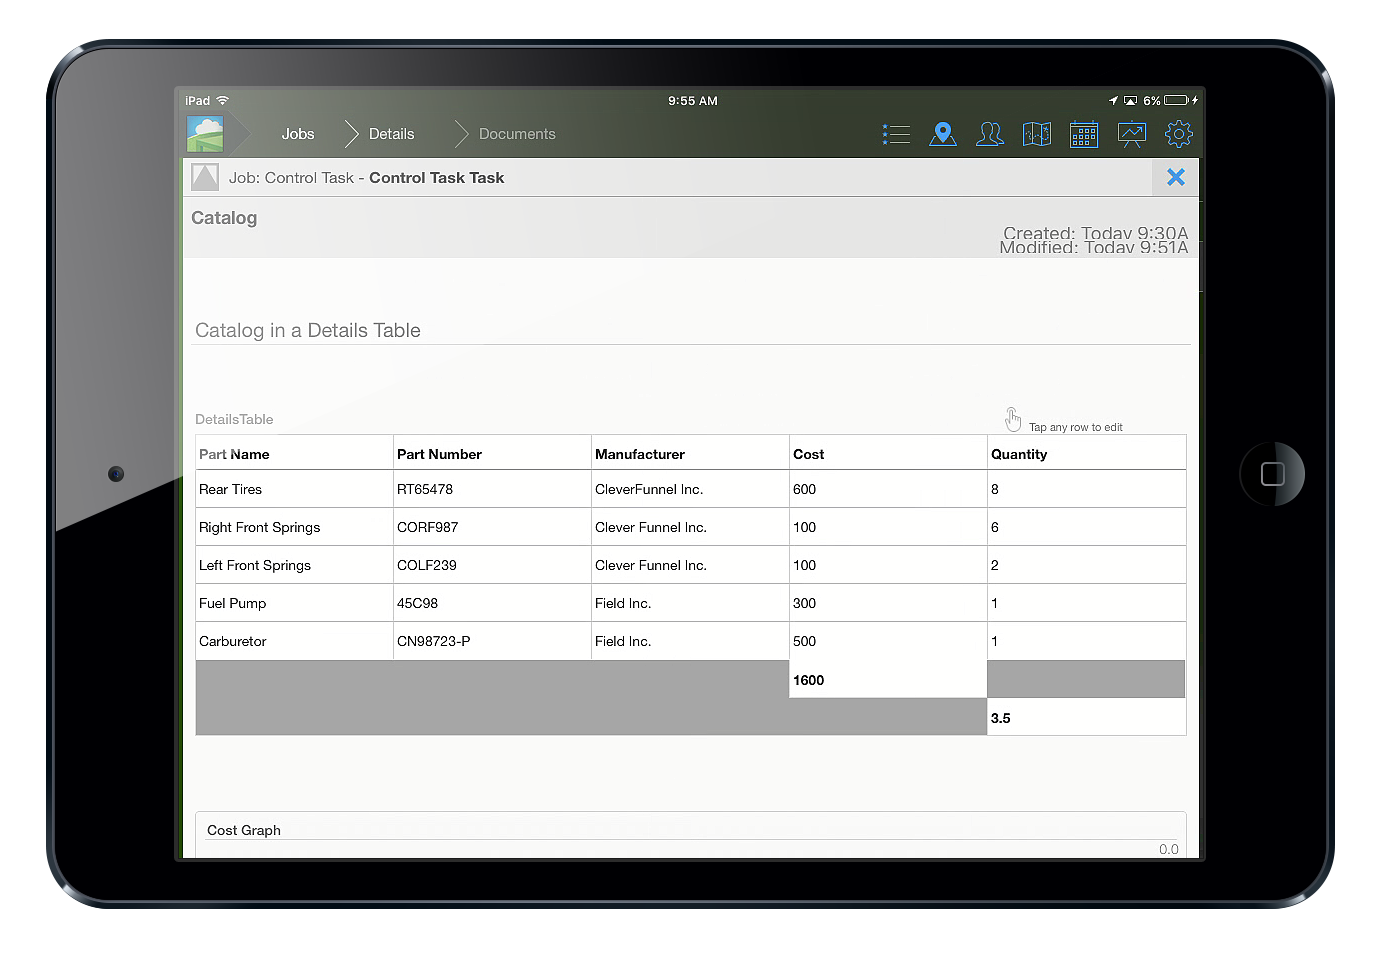
This is the table we are pulling data from. (click to enlarge)