Creating a Report
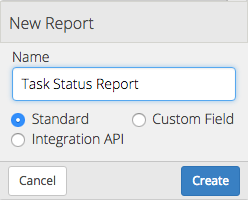
- There are three types of reports that can be created from the Report Builder – Standard, Custom Field, and Integration API reports. The type of report is selected upon creation, or can be adjusted within the report itself.
- Standard: Reports that can be run from the Reports tab, as well as Report Link custom fields.
- Custom Field: Specialized reports to be tied to the Report Link custom field. Gives access to the parent object data in the report.
- Integration API: Used to access the system from a third party API call.
Query Tab
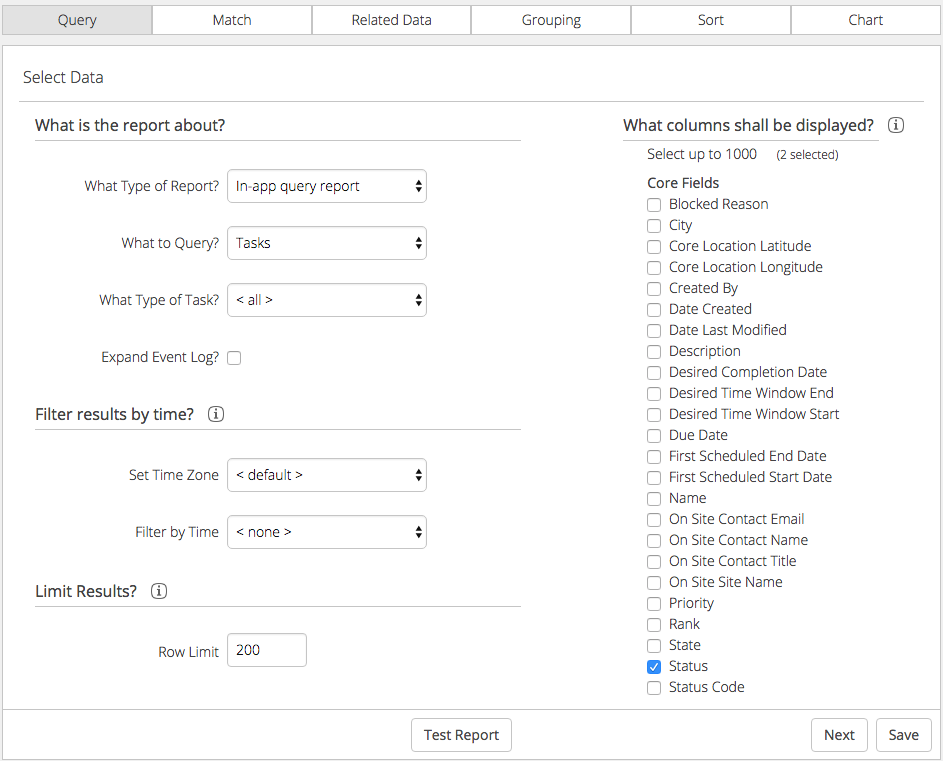
- What is the report about?
- Report type – Select between Standard, Custom Field, or Integration API.
- Query Type – Choose between Tasks, Assets, Documents, Contacts, Users, or Teams
- Specific type – If the query type is a task, asset, or document, you can narrow by type
- Filter Results by Time
- Set time zone – Default is the workspace timezone, or it can be changed here
- Filter by time – Filter by date created, date last updated, or in the case of tasks, date scheduled
- Limit Results
- Row limit – only show the amounts of rows specified here
- Filter by team
- Filter by user
- Visible to specific teams – Only display this report for the teams listed here. Shown to all teams by default.
- Columns Displayed – Each field selected here will create a new column in the report
- Standard fields – Fields available on every object, such as name, date created, date last updated, etc.
- Custom fields – The custom fields for each object. If a task, asset or document, the list here will update when a specific type is selected
Match Tab
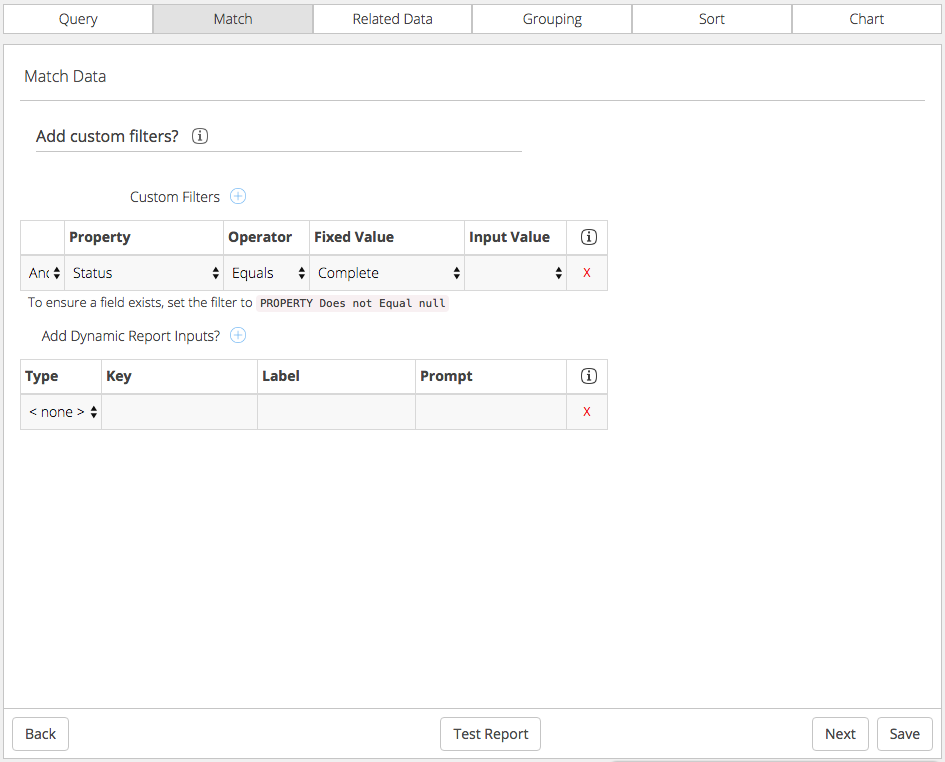
- Custom Filters – The report will only show results that fit these filters
- Connection – Select between And or Or
- Property – This list is generated from the selected fields on the Query tab
- Operator – Equals, does not equal, less than, greater than, etc
- Value – Choose one or the other
- Fixed value – A value typed in here by the user
- Input value – Link this value to a dynamic input. The input must be created before an input value can be assigned.
- Dynamic report inputs – These inputs will appear on the report tab.
- Type: Text, Number, Date, Date Range, Check List, Document Type List, Asset Type List, Task Type List
- Key – Assign a key to the input
- Label – The label that will appear next to the input
- Prompt – What will appear within the input (Text and Number only)
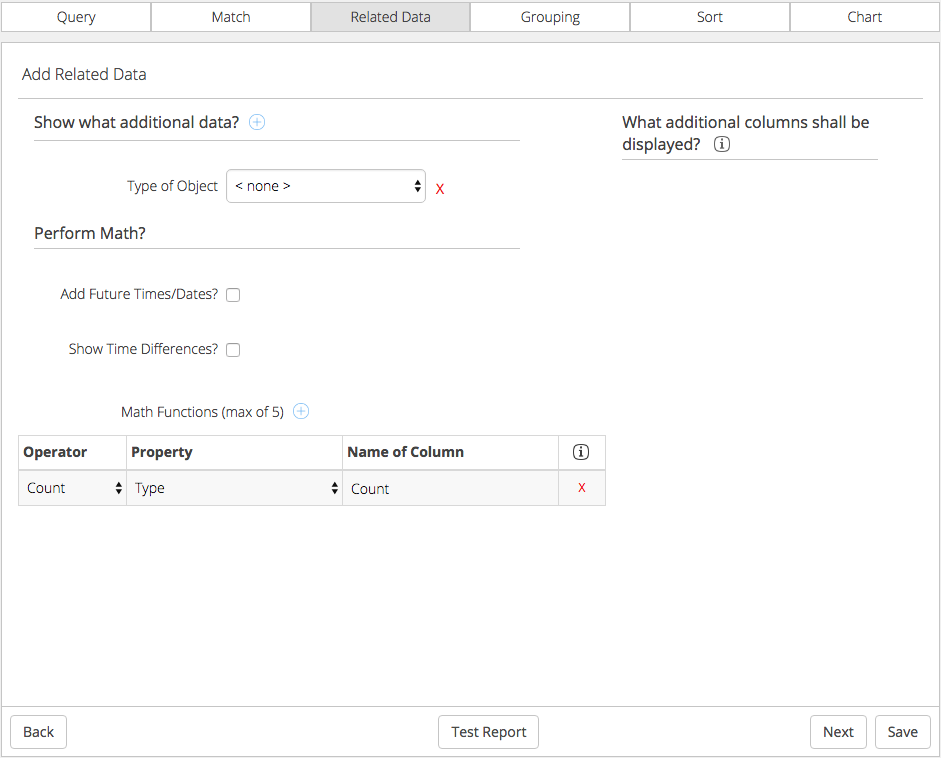
- Show additional data – Can add multiple types of related objects
- Type of object- Will show related objects of the type chosen
- Specific type – if Task, Asset or Document the type included can be specified
- Type of object- Will show related objects of the type chosen
- Additional columns displayed
- For each object chosen, a list of their available fields will be shown
- If the object is a task, asset or document, you can also specify the object type
Grouping Tab
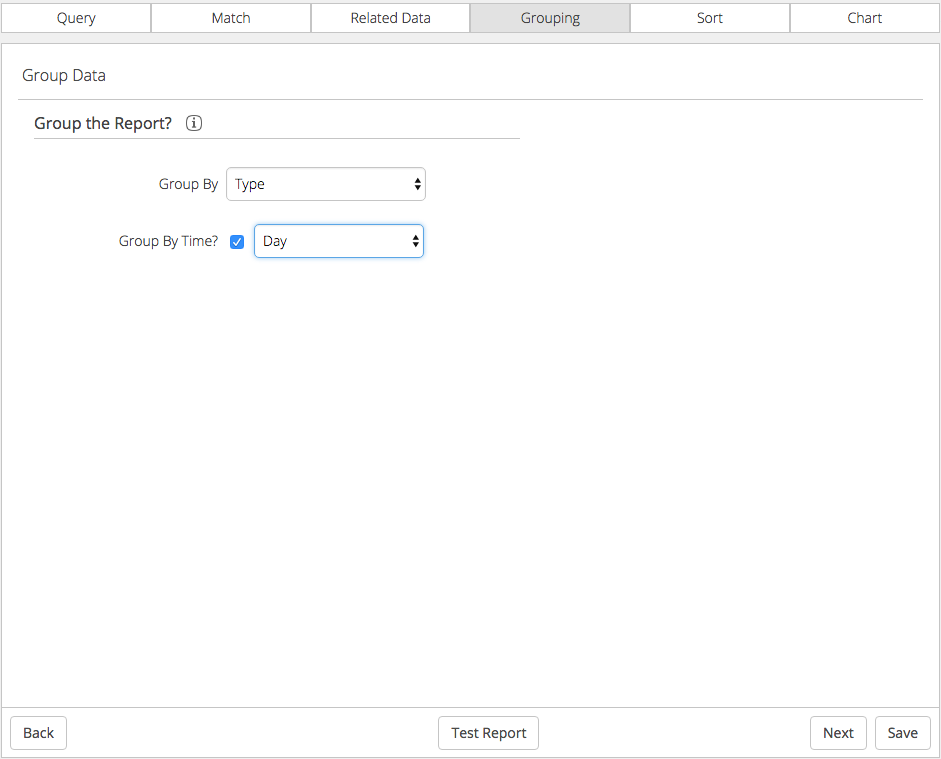
- Group by
- This will collapse all rows that have the same value in the selected column into the same row. Only data that is consistent across all rows is shown.
- For example, if the group by column is task type, one row would be shown for each task type, even if there are many tasks of each type.
- This will collapse all rows that have the same value in the selected column into the same row. Only data that is consistent across all rows is shown.
- Group by time
- If the group by type is a date, you can narrow down the time to minute, hour, day, month, year
- For example, say you have two tasks created on 2/02/18, one at 10:00am and one at 11:45am. If you group by day, these tasks will be condensed to the same row. But if you group by hour, they will be on separate rows.
- If the group by type is a date, you can narrow down the time to minute, hour, day, month, year
Sort Tab
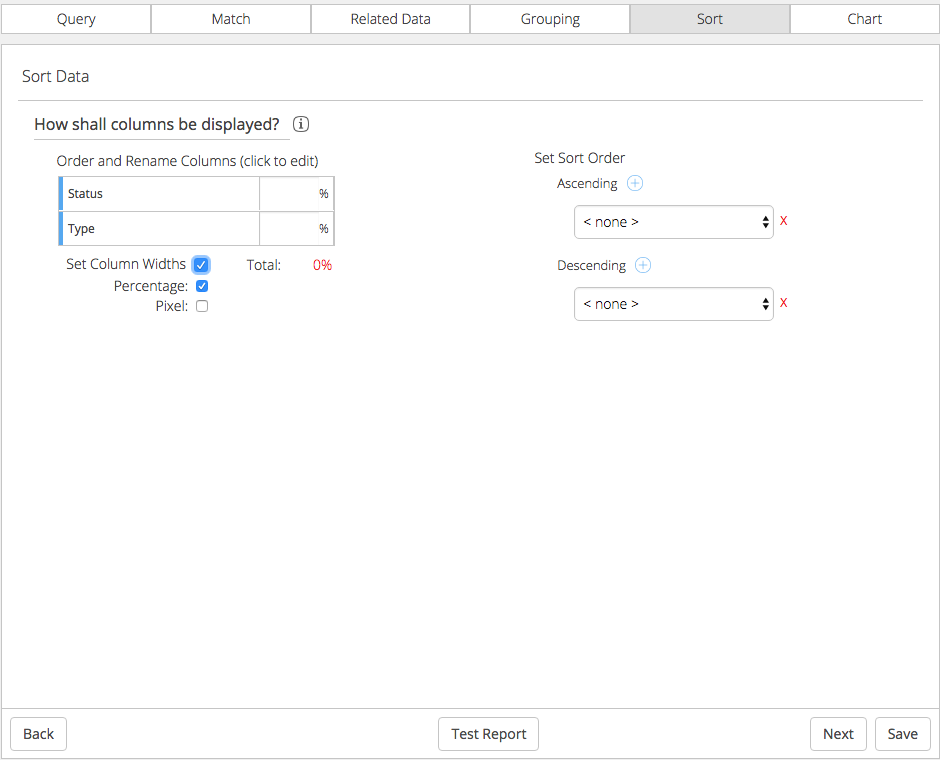
- Column display
- Order – Drag and drop to specify order of columns
- Label – Label can be updated by clicking on the row and updating the text
- Column widths
- If Set Column Widths is selected, each column can be given a width
- Choose between percentage and pixel
- If percentage, the total needs to add up to 100%
- Date format
- Choose between the default DD/MM/YYYY or YYYY/MM/DD
- Sort order
- The sorts will be applied in the order selected
- Can apply ascending or descending sorts
Chart Tab
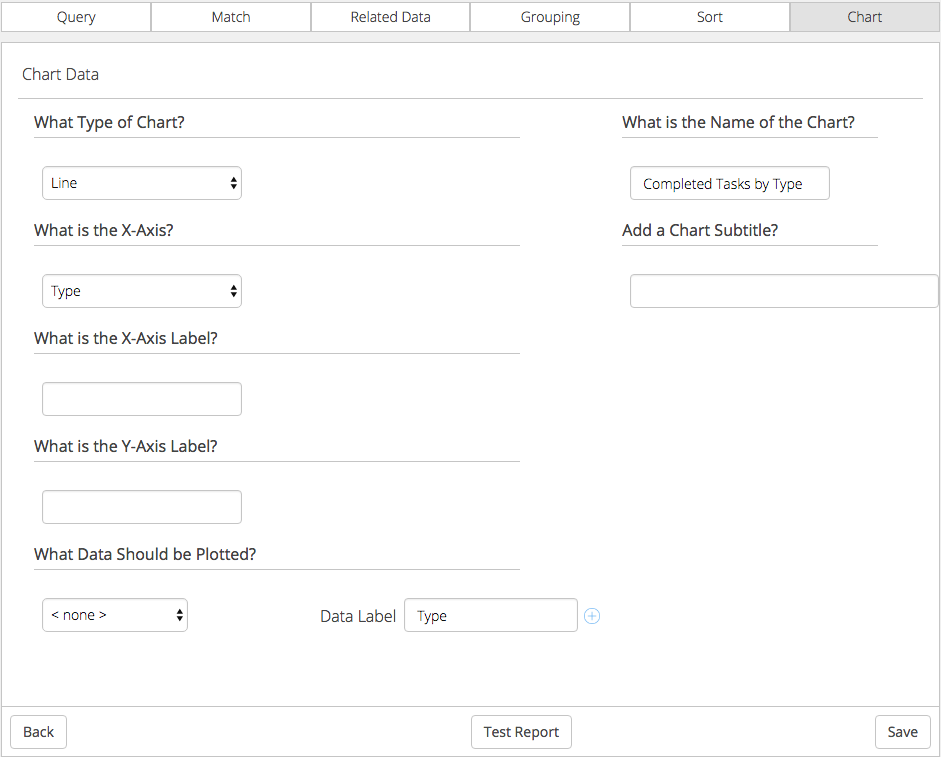
- Type of chart
- Bar – Horizontal bars
- Column – Vertical bars
- Line – Points connected by a line
- Pie – Shows count of a single column as wedges
- 3D Pie – Same as pie, but in 3D wedges
- X-Axis
- X-Axis label
- Y-Axis label
- Data plotted
- Column
- Label
- Chart name – Displayed at the top of the chart
- Chart subtitle – Smaller label displayed under the name